Using D3 for Geographic Data Visualizations & Diff Projections
"Today's best maps are being made with D3, a JavaScript library
that uses the full potential of the web to animate, transform, and decorate." (Stockton, 2013)
Technology at a Glance
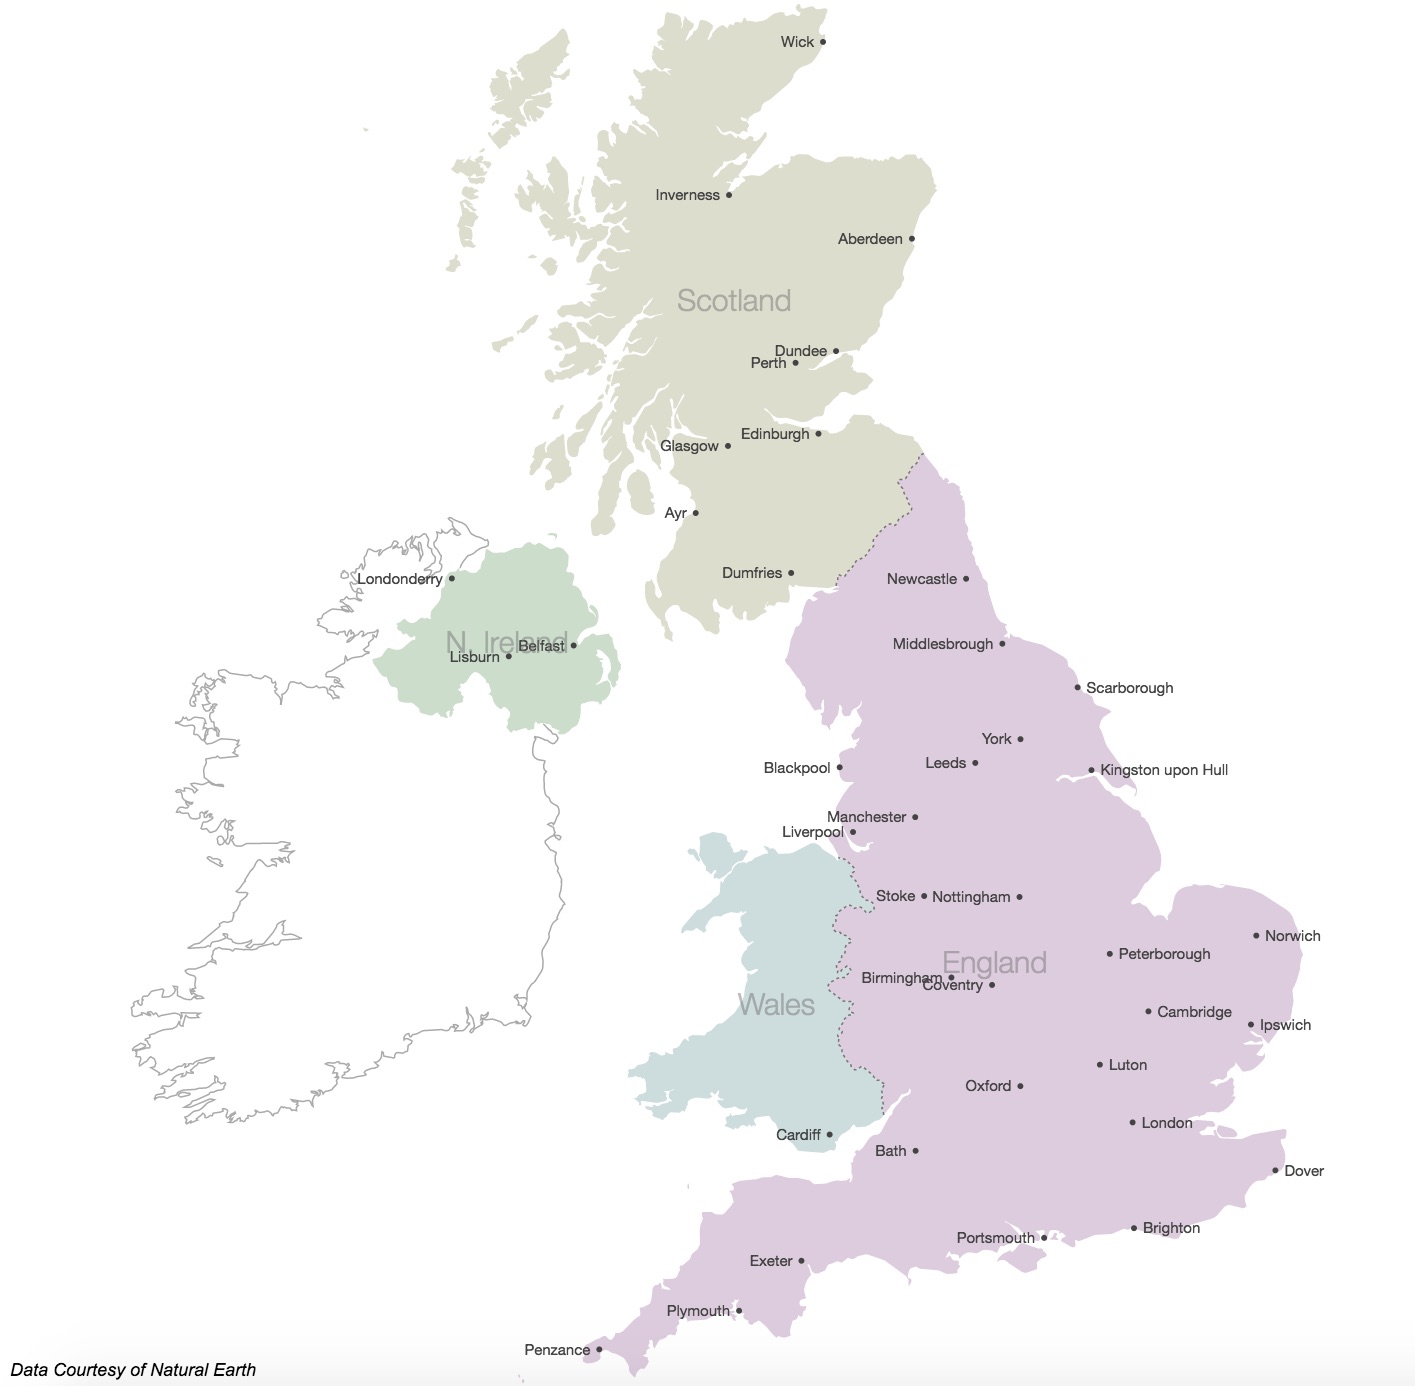
- D3 stands for Data Driven Documents, a JS Library you can include in your webpages; D3's geo module can translate the GeoJSON data that represents the complex geometry of say, U.K. country polygons and make it available to be rendered on a web page as a map.
- D3 gives the geographer a canvas to draw vector map geography onto, using SVG shapes, mostly in the <path> tag; You then can style these vector points, lines and polygons using web standard CSS, JavaScript and HTML.
- In the larger web industry, D3 is used to create charts and graphs and for data dashboards. Now you can use the same data and create both chart and map views of your data, and realize mapping can be thought of as just another kind of data visualization.
- Plus, D3 finally adds the idea of providing multiple geographic projections for mapping your data, breaking the tyranny of Web Mercator dictated for so long by first mover Google Maps and other web mapping APIs.
